> ## Documentation Index
> Fetch the complete documentation index at: https://docs.getcuemanager.com/llms.txt
> Use this file to discover all available pages before exploring further.
# Reports
> Revenue, utilization, and member analytics — with PDF export.
Reports turn the day's sessions, POS sales, members, and expenses into numbers you can act on. There are eight of them, each answering a different question, and all of them can be exported to PDF.
Open **Reports** in the sidebar. The Reports module permission controls access; **Profit & Loss** additionally requires the Expenses module.
## Overview dashboard
**Reports → Dashboard** is the starting point: how much did the club make, and where did it come from?
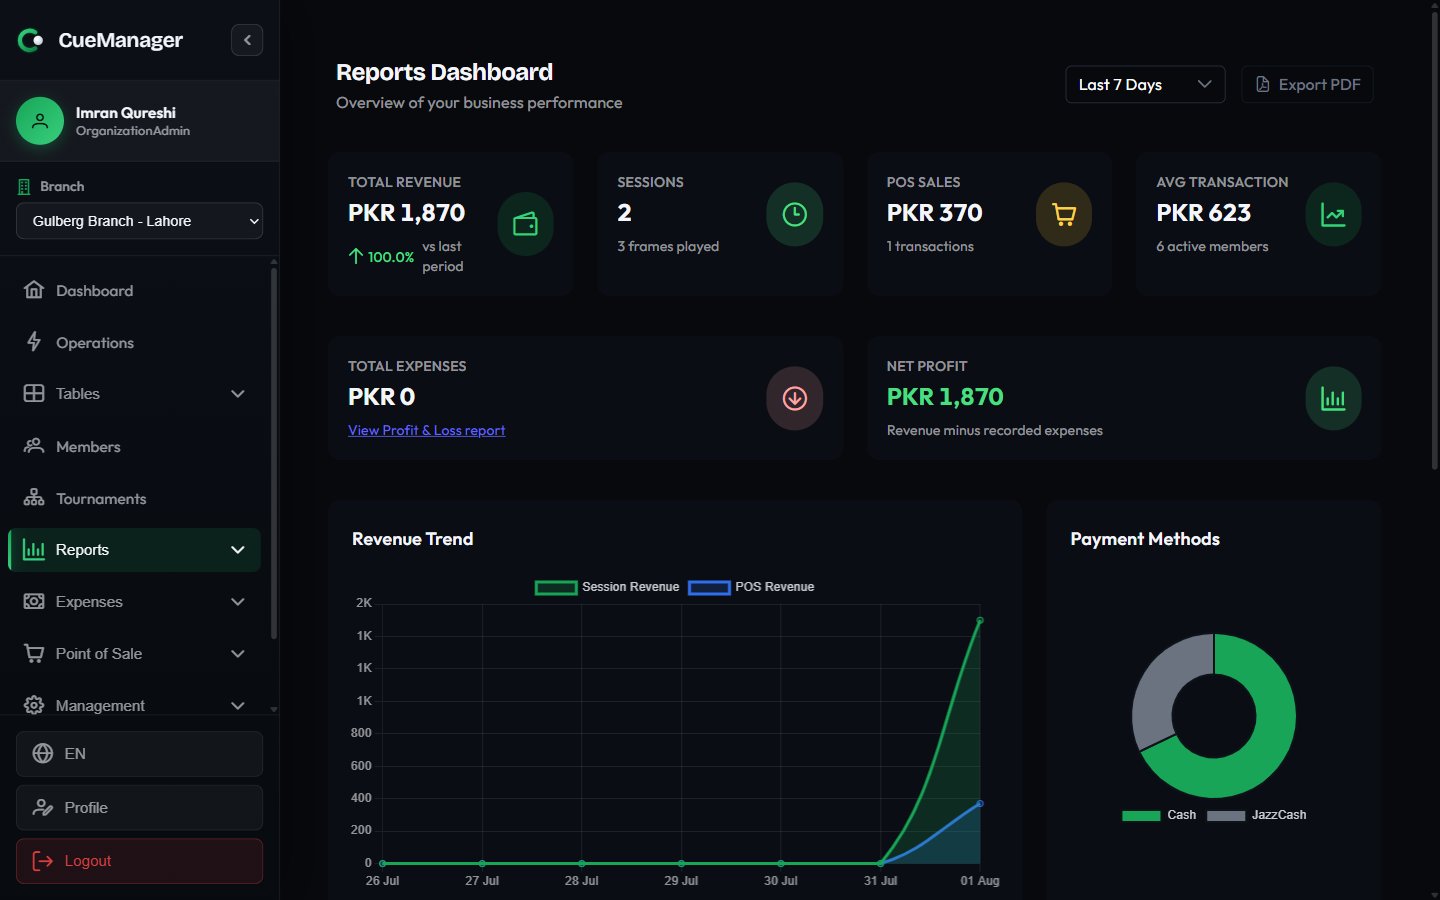 Four KPI cards sit at the top: **Total Revenue** (with the percentage change **vs last period**), **Sessions** with frames played, **POS Sales** with transaction count, and **Avg Transaction** with active member count. If you also have Expenses access, a second row adds **Total Expenses** and **Net Profit**.
Below that:
* **Revenue Trend** — session revenue and POS revenue plotted per day.
* **Payment Methods** — the share taken by each tender, with a **Payment Method Details** table showing transactions, amount, and share.
* **Revenue Breakdown** — session revenue, POS revenue, **Total Discounts**, and **Net Revenue**.
* **Detailed Reports** — quick links into the reports below.
## Sessions
**Reports → Sessions** answers how busy the tables were and what that play earned. It shows **Total Sessions** (with completed count), **Total Frames** and the average per session, **Session Revenue**, and **Avg Duration** with the number of cancelled sessions.
Two charts break the pattern down: **Sessions by Hour** tells you when your peak is, and **Revenue by Day of Week** tells you which days carry the club. The **Table Performance** table lists each table's sessions, frames, revenue, and **Utilization** percentage, so you can see whether Snooker 3 is earning its floor space. A **Session Details** table lists individual sessions.
## Table activity
**Reports → Table Activity** answers who played on each table, with whom, and when — it is the audit trail for a disputed bill. It defaults to **Today** and shows **Sessions**, **Frames**, **Revenue**, and **Active Now**.
Sessions are grouped under their table (Snooker 1, Pool 2, and so on) with the **Time** window, **Players**, session and game type, duration, frames, total, and an **Active** or **Completed** tag. Expand a row to see every frame: the frame number, its time window, the **Winner**, the **Loser (pays)**, and the **Price**. That last pair is how you verify frame billing in practice — see [How billing works](/concepts/how-billing-works).
## POS sales
**Reports → POS Sales** answers what the canteen sold. **Total Revenue** (with discounts), **Transactions**, **Items Sold**, and **Avg Basket** sit at the top, followed by a **Daily Sales Trend**, **Sales by Category**, and **Top Selling Items** — useful for spotting that Chai at Rs 100 carries more of your POS revenue than you thought.
A **Sales Details** table lists every sale with its number, date, **Customer** (or **Walk-in**), item count, total, and payment method.
## Members
**Reports → Members** answers how your membership base is doing. It shows **Total Members** with the active count, **New Members** this period, **Inactive** members who need re-engagement, **Credit Outstanding** across all wallets, and **Membership Revenue** collected this period.
Underneath: a **Member Acquisition Trend** chart of new versus churned members, **Members by Tier**, a **Top Members by Spending** table (sessions, POS transactions, total spending, credit balance), and **Expiring Memberships** with days until expiry — your renewal call list. See [Membership plans](/members/membership-plans).
## Daily summary
**Reports → Daily Report** is the end-of-day close. It takes a single date rather than a range and answers whether the till matches the system.
It shows **Total Revenue**, **Session Revenue**, **POS Revenue**, **Total Frames** with play time, and **Items Sold**. The **Payment Breakdown** panel gives **Cash Received**, **Card Payments**, **Credit Used**, and **Total Discounts** — the figures to check against the cash drawer. **Staff Activity** attributes sessions handled, POS sales, and revenue generated to each staff member, and **Top Selling Items Today** plus **Table Performance** round it out.
## Member balances
**Member Balances** answers a single question: who owes what, right now. Reach it from the **Detailed Reports** links on the dashboard.
It has no date range, because it reflects the current position rather than a period. **Total Owed** and **Members Owing** head the page, and the **Outstanding Balances** table combines open tab balances and unpaid session shares into a **Total Owed** per member, with the **Oldest Unpaid** date. **View** opens the member; **Remind** sends a WhatsApp balance reminder and needs edit access to Members. Use **Refresh** to re-pull the figures.
This is the only report without a PDF export, since it is a live snapshot rather than a period summary. See [Customer tabs](/pos/customer-tabs) for how the balances build up.
## Profit and loss
**Reports → Profit & Loss** answers whether the club actually made money: revenue minus the expenses you recorded, for the selected period.
Four KPI cards sit at the top: **Total Revenue** (with the percentage change **vs last period**), **Sessions** with frames played, **POS Sales** with transaction count, and **Avg Transaction** with active member count. If you also have Expenses access, a second row adds **Total Expenses** and **Net Profit**.
Below that:
* **Revenue Trend** — session revenue and POS revenue plotted per day.
* **Payment Methods** — the share taken by each tender, with a **Payment Method Details** table showing transactions, amount, and share.
* **Revenue Breakdown** — session revenue, POS revenue, **Total Discounts**, and **Net Revenue**.
* **Detailed Reports** — quick links into the reports below.
## Sessions
**Reports → Sessions** answers how busy the tables were and what that play earned. It shows **Total Sessions** (with completed count), **Total Frames** and the average per session, **Session Revenue**, and **Avg Duration** with the number of cancelled sessions.
Two charts break the pattern down: **Sessions by Hour** tells you when your peak is, and **Revenue by Day of Week** tells you which days carry the club. The **Table Performance** table lists each table's sessions, frames, revenue, and **Utilization** percentage, so you can see whether Snooker 3 is earning its floor space. A **Session Details** table lists individual sessions.
## Table activity
**Reports → Table Activity** answers who played on each table, with whom, and when — it is the audit trail for a disputed bill. It defaults to **Today** and shows **Sessions**, **Frames**, **Revenue**, and **Active Now**.
Sessions are grouped under their table (Snooker 1, Pool 2, and so on) with the **Time** window, **Players**, session and game type, duration, frames, total, and an **Active** or **Completed** tag. Expand a row to see every frame: the frame number, its time window, the **Winner**, the **Loser (pays)**, and the **Price**. That last pair is how you verify frame billing in practice — see [How billing works](/concepts/how-billing-works).
## POS sales
**Reports → POS Sales** answers what the canteen sold. **Total Revenue** (with discounts), **Transactions**, **Items Sold**, and **Avg Basket** sit at the top, followed by a **Daily Sales Trend**, **Sales by Category**, and **Top Selling Items** — useful for spotting that Chai at Rs 100 carries more of your POS revenue than you thought.
A **Sales Details** table lists every sale with its number, date, **Customer** (or **Walk-in**), item count, total, and payment method.
## Members
**Reports → Members** answers how your membership base is doing. It shows **Total Members** with the active count, **New Members** this period, **Inactive** members who need re-engagement, **Credit Outstanding** across all wallets, and **Membership Revenue** collected this period.
Underneath: a **Member Acquisition Trend** chart of new versus churned members, **Members by Tier**, a **Top Members by Spending** table (sessions, POS transactions, total spending, credit balance), and **Expiring Memberships** with days until expiry — your renewal call list. See [Membership plans](/members/membership-plans).
## Daily summary
**Reports → Daily Report** is the end-of-day close. It takes a single date rather than a range and answers whether the till matches the system.
It shows **Total Revenue**, **Session Revenue**, **POS Revenue**, **Total Frames** with play time, and **Items Sold**. The **Payment Breakdown** panel gives **Cash Received**, **Card Payments**, **Credit Used**, and **Total Discounts** — the figures to check against the cash drawer. **Staff Activity** attributes sessions handled, POS sales, and revenue generated to each staff member, and **Top Selling Items Today** plus **Table Performance** round it out.
## Member balances
**Member Balances** answers a single question: who owes what, right now. Reach it from the **Detailed Reports** links on the dashboard.
It has no date range, because it reflects the current position rather than a period. **Total Owed** and **Members Owing** head the page, and the **Outstanding Balances** table combines open tab balances and unpaid session shares into a **Total Owed** per member, with the **Oldest Unpaid** date. **View** opens the member; **Remind** sends a WhatsApp balance reminder and needs edit access to Members. Use **Refresh** to re-pull the figures.
This is the only report without a PDF export, since it is a live snapshot rather than a period summary. See [Customer tabs](/pos/customer-tabs) for how the balances build up.
## Profit and loss
**Reports → Profit & Loss** answers whether the club actually made money: revenue minus the expenses you recorded, for the selected period.
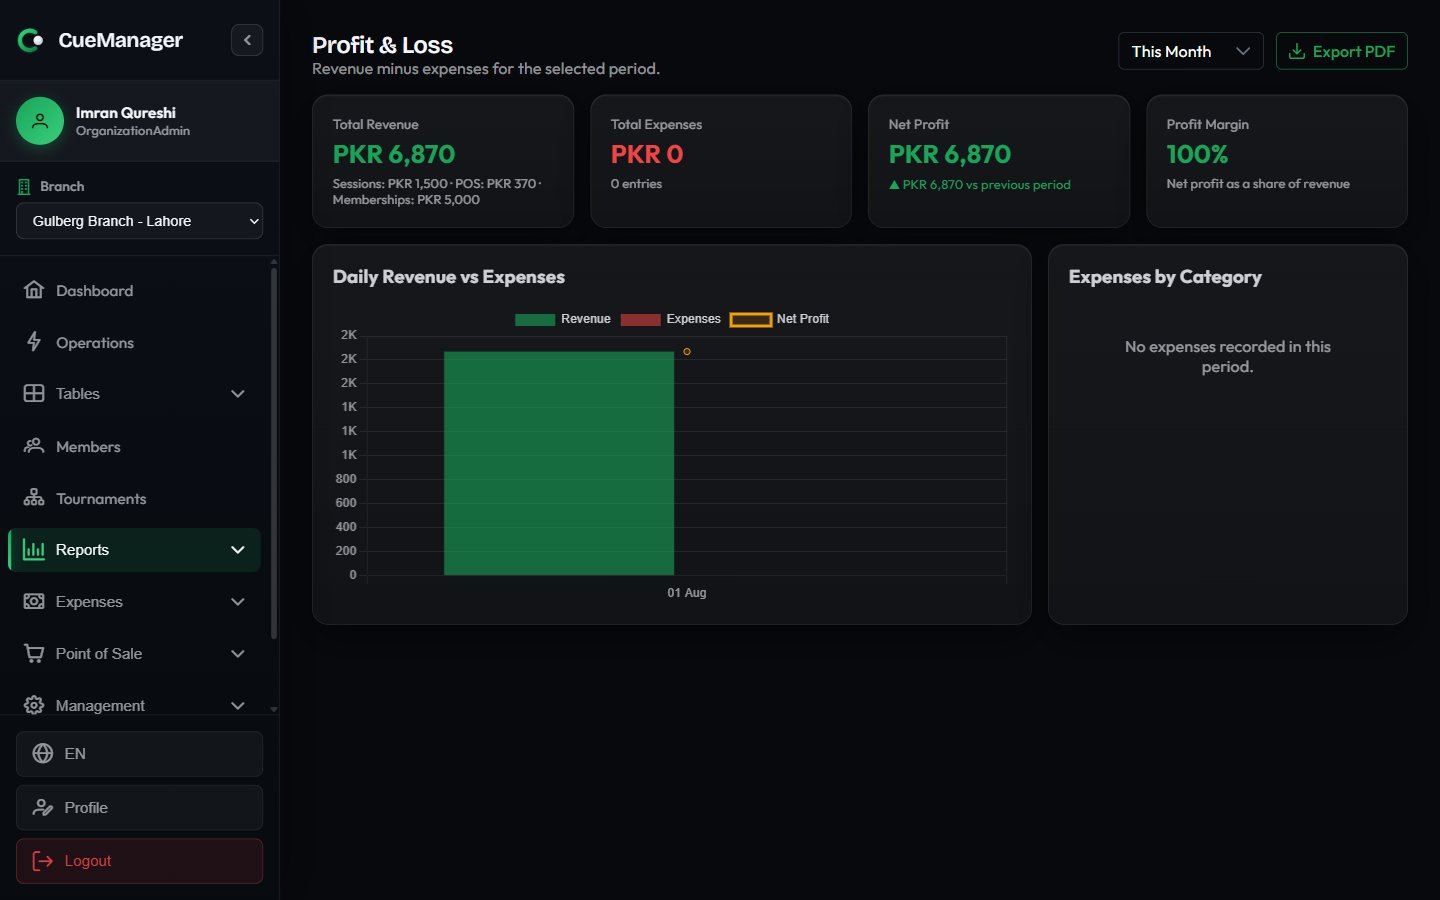 **Total Revenue** breaks into sessions, POS, and memberships. **Total Expenses** shows the number of entries behind it. **Net Profit** is compared against the previous period, and **Profit Margin** expresses net profit as a share of revenue. **Daily Revenue vs Expenses** charts the two side by side with net profit overlaid, **Expenses by Category** shows where the money went, and a **Category Breakdown** table gives amounts and shares.
For multi-branch clubs, a **By Branch** table compares revenue, expenses, and net profit per branch. Branch revenue there covers sessions and POS sales; organisation-level membership income and tab discounts appear only in the totals above.
This report needs both Reports view and Expenses view. A user with Reports access alone cannot open it, and the expense and net-profit cards on the dashboard stay hidden for them — that is deliberate, since expense totals include salaries.
## Date ranges, branches, and export
Every report except Member Balances and Daily Report uses the same date-range control: **Today**, **Last 7 Days**, **Last 30 Days**, **This Month**, **Last Month**, or **Custom**, which reveals a date picker for an exact range. Daily Report takes a single date instead.
| Report | Default range |
| ------------------------------ | -------------- |
| Dashboard, Sessions, POS Sales | Last 7 Days |
| Table Activity | Today |
| Members | Last 30 Days |
| Profit & Loss | This Month |
| Daily Report | Today's date |
| Member Balances | Live, no range |
Reports are scoped to the branch you have selected in the app. SuperAdmins get an extra branch dropdown on each report, with **All Branches** as the cleared option, so they can compare locations without switching context — see [Branches](/admin/branches).
**Export PDF** at the top right renders the report exactly as displayed, charts included. Set your date range and branch first: the export captures what is on screen.
## Related pages
Record spending so Profit & Loss has a cost side.
What generates the session revenue you are reading.
Who can open which report.
The at-a-glance view for the current shift.
**Total Revenue** breaks into sessions, POS, and memberships. **Total Expenses** shows the number of entries behind it. **Net Profit** is compared against the previous period, and **Profit Margin** expresses net profit as a share of revenue. **Daily Revenue vs Expenses** charts the two side by side with net profit overlaid, **Expenses by Category** shows where the money went, and a **Category Breakdown** table gives amounts and shares.
For multi-branch clubs, a **By Branch** table compares revenue, expenses, and net profit per branch. Branch revenue there covers sessions and POS sales; organisation-level membership income and tab discounts appear only in the totals above.
This report needs both Reports view and Expenses view. A user with Reports access alone cannot open it, and the expense and net-profit cards on the dashboard stay hidden for them — that is deliberate, since expense totals include salaries.
## Date ranges, branches, and export
Every report except Member Balances and Daily Report uses the same date-range control: **Today**, **Last 7 Days**, **Last 30 Days**, **This Month**, **Last Month**, or **Custom**, which reveals a date picker for an exact range. Daily Report takes a single date instead.
| Report | Default range |
| ------------------------------ | -------------- |
| Dashboard, Sessions, POS Sales | Last 7 Days |
| Table Activity | Today |
| Members | Last 30 Days |
| Profit & Loss | This Month |
| Daily Report | Today's date |
| Member Balances | Live, no range |
Reports are scoped to the branch you have selected in the app. SuperAdmins get an extra branch dropdown on each report, with **All Branches** as the cleared option, so they can compare locations without switching context — see [Branches](/admin/branches).
**Export PDF** at the top right renders the report exactly as displayed, charts included. Set your date range and branch first: the export captures what is on screen.
## Related pages
Record spending so Profit & Loss has a cost side.
What generates the session revenue you are reading.
Who can open which report.
The at-a-glance view for the current shift.