

Overview dashboard
Reports → Dashboard is the starting point: how much did the club make, and where did it come from?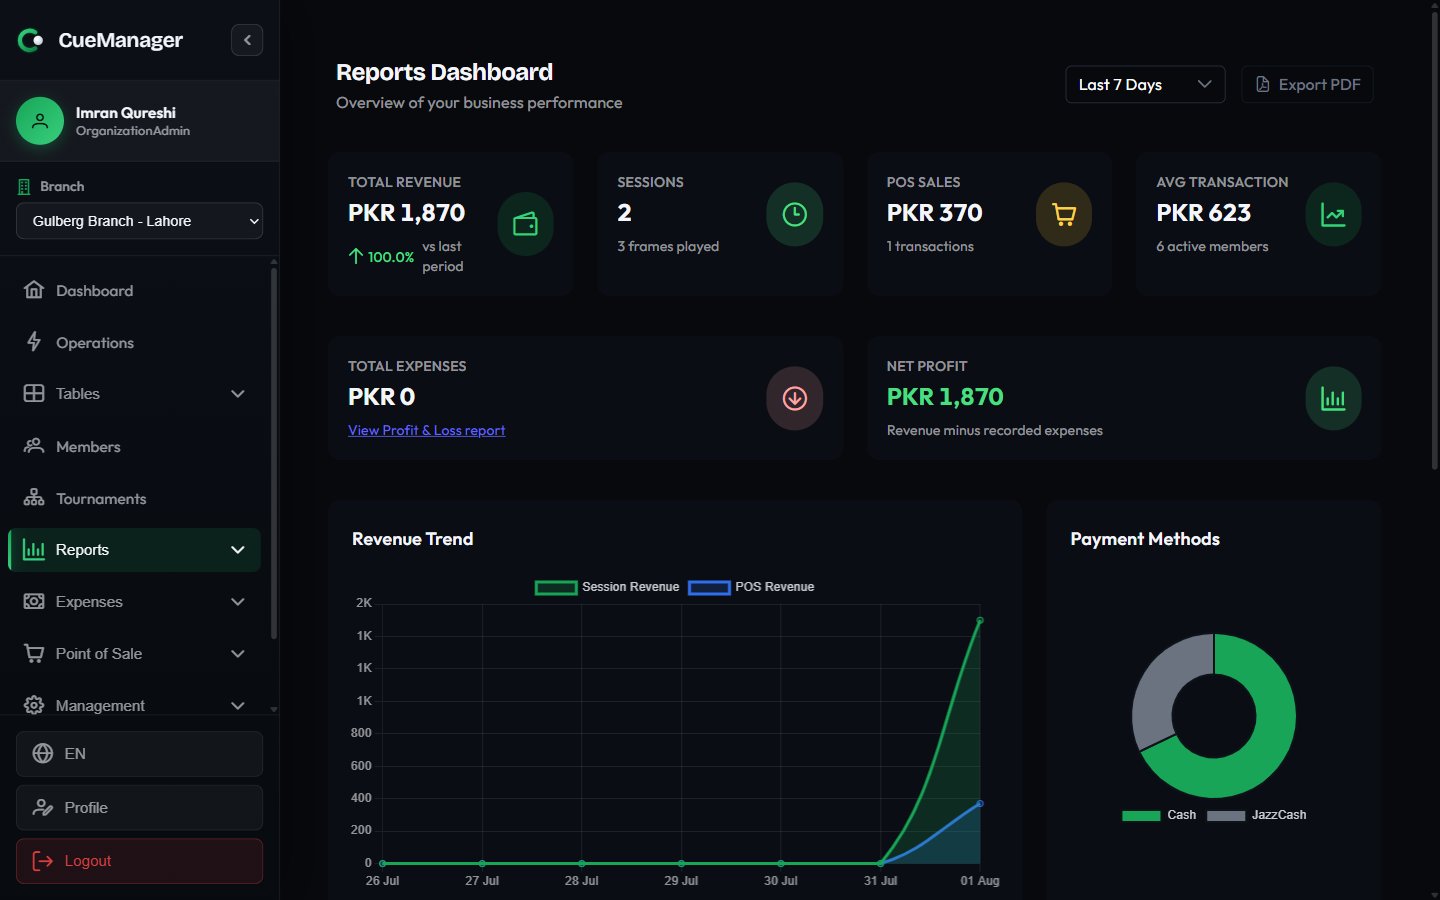
The reports dashboard with revenue KPIs, trend chart, and payment mix
- Revenue Trend — session revenue and POS revenue plotted per day.
- Payment Methods — the share taken by each tender, with a Payment Method Details table showing transactions, amount, and share.
- Revenue Breakdown — session revenue, POS revenue, Total Discounts, and Net Revenue.
- Detailed Reports — quick links into the reports below.
Sessions
Reports → Sessions answers how busy the tables were and what that play earned. It shows Total Sessions (with completed count), Total Frames and the average per session, Session Revenue, and Avg Duration with the number of cancelled sessions. Two charts break the pattern down: Sessions by Hour tells you when your peak is, and Revenue by Day of Week tells you which days carry the club. The Table Performance table lists each table’s sessions, frames, revenue, and Utilization percentage, so you can see whether Snooker 3 is earning its floor space. A Session Details table lists individual sessions.Table activity
Reports → Table Activity answers who played on each table, with whom, and when — it is the audit trail for a disputed bill. It defaults to Today and shows Sessions, Frames, Revenue, and Active Now. Sessions are grouped under their table (Snooker 1, Pool 2, and so on) with the Time window, Players, session and game type, duration, frames, total, and an Active or Completed tag. Expand a row to see every frame: the frame number, its time window, the Winner, the Loser (pays), and the Price. That last pair is how you verify frame billing in practice — see How billing works.POS sales
Reports → POS Sales answers what the canteen sold. Total Revenue (with discounts), Transactions, Items Sold, and Avg Basket sit at the top, followed by a Daily Sales Trend, Sales by Category, and Top Selling Items — useful for spotting that Chai at Rs 100 carries more of your POS revenue than you thought. A Sales Details table lists every sale with its number, date, Customer (or Walk-in), item count, total, and payment method.Members
Reports → Members answers how your membership base is doing. It shows Total Members with the active count, New Members this period, Inactive members who need re-engagement, Credit Outstanding across all wallets, and Membership Revenue collected this period. Underneath: a Member Acquisition Trend chart of new versus churned members, Members by Tier, a Top Members by Spending table (sessions, POS transactions, total spending, credit balance), and Expiring Memberships with days until expiry — your renewal call list. See Membership plans.Daily summary
Reports → Daily Report is the end-of-day close. It takes a single date rather than a range and answers whether the till matches the system. It shows Total Revenue, Session Revenue, POS Revenue, Total Frames with play time, and Items Sold. The Payment Breakdown panel gives Cash Received, Card Payments, Credit Used, and Total Discounts — the figures to check against the cash drawer. Staff Activity attributes sessions handled, POS sales, and revenue generated to each staff member, and Top Selling Items Today plus Table Performance round it out.Member balances
Member Balances answers a single question: who owes what, right now. Reach it from the Detailed Reports links on the dashboard. It has no date range, because it reflects the current position rather than a period. Total Owed and Members Owing head the page, and the Outstanding Balances table combines open tab balances and unpaid session shares into a Total Owed per member, with the Oldest Unpaid date. View opens the member; Remind sends a WhatsApp balance reminder and needs edit access to Members. Use Refresh to re-pull the figures.This is the only report without a PDF export, since it is a live snapshot rather than a period summary. See Customer tabs for how the balances build up.
Profit and loss
Reports → Profit & Loss answers whether the club actually made money: revenue minus the expenses you recorded, for the selected period.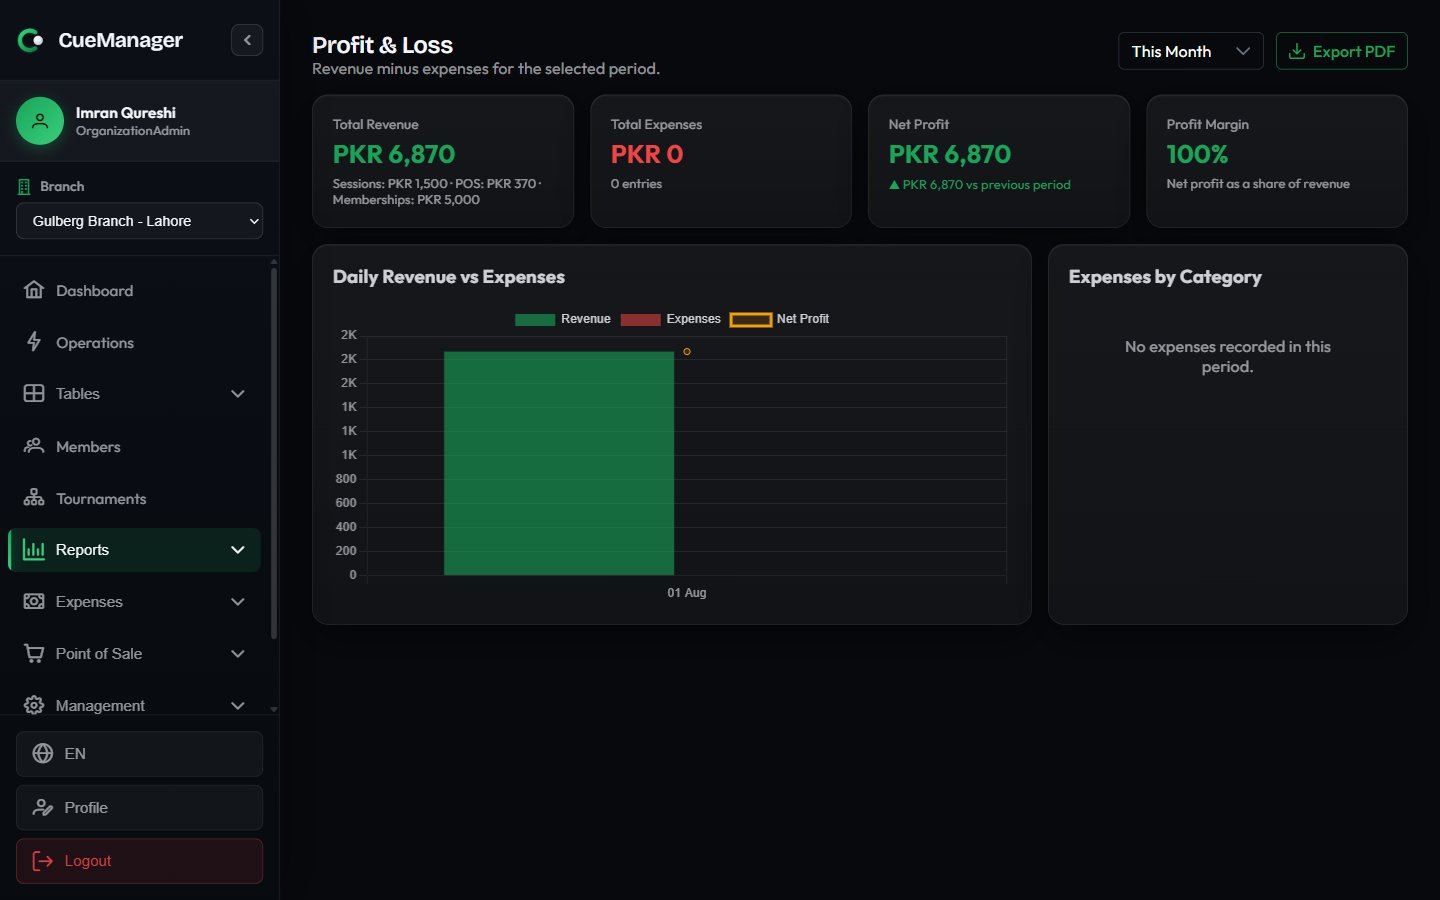
Profit and loss with revenue, expenses, net profit, and margin
Date ranges, branches, and export
Every report except Member Balances and Daily Report uses the same date-range control: Today, Last 7 Days, Last 30 Days, This Month, Last Month, or Custom, which reveals a date picker for an exact range. Daily Report takes a single date instead.
Reports are scoped to the branch you have selected in the app. SuperAdmins get an extra branch dropdown on each report, with All Branches as the cleared option, so they can compare locations without switching context — see Branches.
Export PDF at the top right renders the report exactly as displayed, charts included. Set your date range and branch first: the export captures what is on screen.
Related pages
Expenses
Record spending so Profit & Loss has a cost side.
How billing works
What generates the session revenue you are reading.
Roles and permissions
Who can open which report.
Dashboard
The at-a-glance view for the current shift.